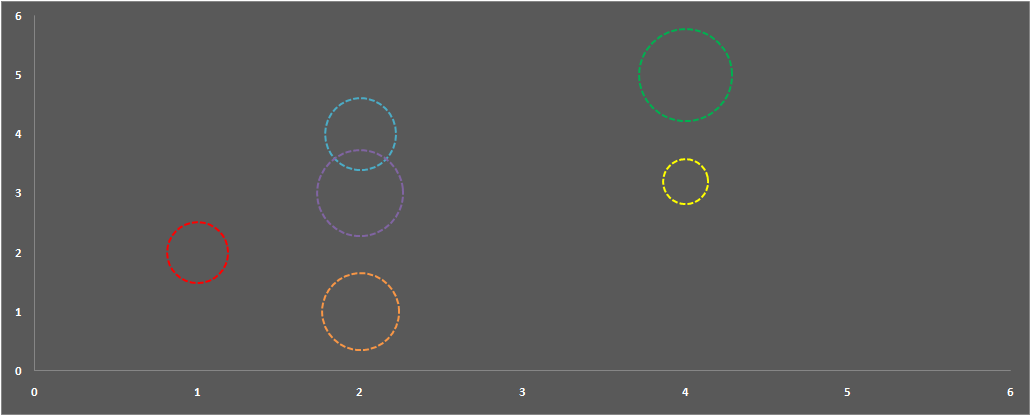
Change the style and color of bubbles using VBA. Snapshot below -
![]()
All you need to create a table with series name mentioned in cells and add color to cells next to it Snapshot below -
![]()
Macro to format chart -
Sub format_chart()
Dim srs As Series
Dim cht As Chart
Set cht = Sheets("Sheet1").ChartObjects("Chart 1").Chart
For Each srs In cht.SeriesCollection
'change marker color
' change border
srs.Border.Color = Range("e"& Application.WorksheetFunction.Match(srs.Name, Sheets("Sheet1").Range("a:a"), 0)).Interior.Color
srs.Border.Weight = 3
srs.Border.LineStyle = xlDot ' change style here
'srs.Format.Fill.BackColor.RGB = RGB(255, 153, 153)
srs.Format.Fill.Visible = msoFalse
Next srs
End Sub
Download working File
All you need to create a table with series name mentioned in cells and add color to cells next to it Snapshot below -

Macro to format chart -
Sub format_chart()
Dim srs As Series
Dim cht As Chart
Set cht = Sheets("Sheet1").ChartObjects("Chart 1").Chart
For Each srs In cht.SeriesCollection
'change marker color
' change border
srs.Border.Color = Range("e"& Application.WorksheetFunction.Match(srs.Name, Sheets("Sheet1").Range("a:a"), 0)).Interior.Color
srs.Border.Weight = 3
srs.Border.LineStyle = xlDot ' change style here
'srs.Format.Fill.BackColor.RGB = RGB(255, 153, 153)
srs.Format.Fill.Visible = msoFalse
Next srs
End Sub
Download working File


