Quantcast
Channel: Excel VBA Codes & Macros
Viewing all 52 articles
Browse latest View live

Add and Remove fill colors from chart Using VBA

$
0
0
If you want to add or remove fill colors from chart.Try this macro - 


Macro to add fill color 

Sub add_fill_colors()
    Dim cht As Chart
    ' change chart name here
    Set cht = Sheets("Sheet1").ChartObjects("Chart 3").Chart
    'add fill color to chart area
    cht.ChartArea.Interior.Color = RGB(205, 104, 137)
    ' add fill color to Plot Area
    cht.PlotArea.Interior.Color = RGB(205, 193, 197)
End Sub


Macro to remove fill color

Sub remove_fill_colors()
    Dim cht As Chart
    ' change chart name here
    Set cht = Sheets("Sheet1").ChartObjects("Chart 3").Chart
    'Remove fill color from chart area
    cht.ChartArea.Fill.Visible = False
    'remove fill color from Plot Area
    cht.PlotArea.Fill.Visible = False
End Sub

Add image as background to chart using VBA

$
0
0
If you want to add an image to the chart as background . Try this macro


Sub add_image_background()

Dim cht As Chart
Dim imgpath As String

imgpath = "C:\Documents and Settings\All Users\Documents\My Pictures\Sample Pictures\blue hills.jpg"

'change chart name here
Set cht = Sheets("Sheet1").ChartObjects("Chart 3").Chart

With cht.ChartArea
    .Fill.UserPicture PictureFile:=imgpath
    .Fill.Visible = True
End With

End Sub

Delete all charts on worksheet using VBA

$
0
0
If you want to delete all the charts on the worksheet.Try this macro


Sub delete_all_chats()

Dim shp  As Shape

' change sheet name here
For Each shp In Sheets("sheet2").Shapes
    If shp.Type = msoChart Then
        shp.Delete
    End If
Next

End Sub


Set chart axis options using VBA

$
0
0
If you want to set chart axis options using VBA. Try this macro


Sub set_axis_options()

Dim cht As Chart
'change chart name here
Set cht = Sheets("Sheet1").ChartObjects("Chart 3").Chart
    
    With cht.Axes(xlValue, xlPrimary)
        .MaximumScale = 16
        .MinimumScale = 0
        .MajorUnit = 2
        .TickLabels.NumberFormat = "0.0"
        .TickLabels.Orientation = 0
        .TickLabelPosition = xlLow
        .TickLabels.Font.Color = vbBlack
        .Border.Color = vbBlack
        .Border.Weight = xlThin
        .ReversePlotOrder = False
    End With
  
    
End Sub

Hide and Un-hide Chart Axis using VBA

$
0
0
If you want to hide or un-hide chart axis. Try this macro


Macro to hide chart Axis


Sub hide_chart_axis()

Dim cht As Chart
'change chart name here
Set cht = Sheets("Sheet1").ChartObjects("Chart 3").Chart
    
    With cht.Axes(xlValue, xlPrimary)
        .Border.LineStyle = xlNone
        .MajorTickMark = xlNone
        .MinorTickMark = xlNone
        .TickLabelPosition = xlNone
    End With
     
       With cht.Axes(xlCategory, xlPrimary)
        .Border.LineStyle = xlNone
        .MajorTickMark = xlNone
        .MinorTickMark = xlNone
        .TickLabelPosition = xlNone
    End With
      
    
End Sub


Macro to un-hide chart Axis

Sub un_hide_chart_axis()

Dim cht As Chart
'change chart name here
Set cht = Sheets("Sheet1").ChartObjects("Chart 3").Chart
    
    With cht.Axes(xlValue, xlPrimary)
        .Border.Weight = xlHairline
        .MajorTickMark = xlNone
        .MajorTickMark = xlTickMarkOutside
        .TickLabelPosition = xlLow
    End With
     
       With cht.Axes(xlCategory, xlPrimary)
        .Border.Weight = xlHairline
        .Border.LineStyle = xlContinuous
        .MajorTickMark = xlTickMarkOutside
        .MinorTickMark = xlNone
        .TickLabelPosition = xlLow
    End With
      
    
End Sub

Color Chart Series on the Basis of Category Name

$
0
0
If you want to set the color of series in the chart on the basis of category names. Try this code -


Sub cond_format_charts()

Dim cht As Chart

Dim srs As Series
Dim i As Long

Dim rng As Range


'change chart name here

Set cht = Sheets("Sheet1").ChartObjects("Chart 3").Chart

' set series here

Set srs = cht.SeriesCollection(1)

    For i = 1 To srs.Points.Count

        For Each rng In Sheets("Sheet1").Range("j5:j10").Cells
            If UCase(srs.XValues(i)) = UCase(rng.Value) Then
                srs.Points(i).Interior.Color = rng.Offset(0, 2).Interior.Color
                Exit For
            End If
        Next
    Next

End Sub


Add Custom DataLabels in Chart

$
0
0
If you want to add your own datalabels to series in the chart .Try this macro


Sub custom_chart_labels()
Dim cht As Chart
Dim i As Long
Dim srs As Series
Dim lbl As String

'change the chart name here
Set cht = Sheets("Sheet1").ChartObjects("Chart 1").Chart
Set srs = cht.SeriesCollection(1)

For i = 1 To srs.Points.Count
' change the llokup column if required
lbl = Sheets("Sheet1").Range("c"& Application.WorksheetFunction.Match(srs.XValues(i), Sheets("Sheet1").Range("a:a"), 0))
    With srs.Points(i)
        .HasDataLabel = True
        ' add custom data labels
        With .DataLabel
            .Text = lbl
            .Position = xlLabelPositionOutsideEnd
            .Font.Bold = True
            .Font.Italic = True
            .Font.Size = 8
            .Font.Color = RGB(255, 255, 255)
            .Orientation = xlHorizontal
            .Format.Fill.BackColor.RGB = RGB(255, 0, 0)
            .Format.Fill.ForeColor.RGB = RGB(255, 0, 0)
        End With
    End With
    
Next

End Sub


Sort Worksheet Tabs on Name

$
0
0
If you want to arrange /sort worksheet tabs on the name .Try this Macro


Sub sort_worksheet_by_name()

Dim i As Long
Dim j As Long

For i = 1 To Sheets.Count
    For j = i To Sheets.Count
        If UCase(Sheets(j).Name) < UCase(Sheets(i).Name) Then
              Sheets(j).Move Before:=Sheets(i)
         End If
    Next
Next


End Sub


Steps to Use
  • Copy the below code
  • Press Alt+F11 to open VBA editor
  • Paste it in any public module or module 1
  • Run the Macro

Hide and Un-hide Data Lables Using VBA

$
0
0
If you want to add data labels to Chart using VBA. Try this macro -


To view Data Labels


Sub show_data_labels()
Dim cht As Chart
Dim i As Long
Dim srs As Series

Set cht = Sheets("Sheet1").ChartObjects("Chart 1").Chart
Set srs = cht.SeriesCollection(1)

For i = 1 To srs.Points.Count
    With srs.Points(i)
        .HasDataLabel = True
        With .DataLabel
            .Type = xlDataLabelsShowValue
            .Position = xlLabelPositionOutsideEnd
            .Font.Bold = True
            .Font.Italic = True
            .Font.Size = 8
            .Font.Color = RGB(0, 0, 0)
            .Orientation = xlHorizontal
        End With
    End With
Next

End Sub


To Hide Data Labels


Sub hide_data_labels()
    Dim cht As Chart
    Dim i As Long
    Dim srs As Series
    
    Set cht = Sheets("Sheet1").ChartObjects("Chart 1").Chart
    Set srs = cht.SeriesCollection(1)
    
    For i = 1 To srs.Points.Count
        srs.Points(i).HasDataLabel = False
    Next

End Sub


Download Working File

Hide all data label less than any percentage in Pie Chart Using VBA

$
0
0
If you want to hide all the data labels in a pie chart which are less than any specific percentage. Try this macro it will hide all data labels in chart which are less than 10%


Example 1  - Hide all data labels less than 10%

Sub hide_data_labels_1()
Dim cht As Chart
Dim i As Long
Dim srs As Series

Set cht = Sheets("Sheet1").ChartObjects("Chart 1").Chart
Set srs = cht.SeriesCollection(1)

For i = 1 To srs.Points.Count
    With srs.Points(i)
        .HasDataLabel = True
        With .DataLabel
            .Type = xlDataLabelsShowPercent
            .Position = xlLabelPositionBestFit
            .Font.Bold = True
            .Font.Italic = True
            .Font.Size = 8
            .Font.Color = RGB(0, 0, 0)
            .Orientation = xlHorizontal
        End With
         'hide data lables <10 font="">10>
         If CInt(Left(.DataLabel.Text, Len(.DataLabel.Text) - 1)) < 10 Then .HasDataLabel = False
    End With
Next

End Sub

Example 2  - Hide all data labels less than 10%. When you have added multiple option in data label like Category Name ,Percentage , etc.


Sub hide_data_labels_2()
Dim cht As Chart
Dim i As Long
Dim srs As Series
Dim lbl As String
Set cht = Sheets("Sheet1").ChartObjects("Chart 2").Chart
Set srs = cht.SeriesCollection(1)

For i = 1 To srs.Points.Count
    With srs.Points(i)
        .HasDataLabel = True
        With .DataLabel
            .Type = xlDataLabelsShowLabelAndPercent
            .Separator = ";"
            .Position = xlLabelPositionBestFit
            .Font.Bold = True
            .Font.Italic = True
            .Font.Size = 8
            .Font.Color = RGB(0, 0, 0)
            .Orientation = xlHorizontal
        End With
        'hide data lables <10 font="">10>
        lbl = .DataLabel.Text
        'we are using Instrev because percentage is always displayed at the last
        lbl = Right(lbl, Len(lbl) - InStrRev(lbl, ";")) ' pass seperator
        If CInt(Left(lbl, Len(lbl) - 1)) < 10 Then .HasDataLabel = False
    End With
Next

End Sub


Hide - Unhide Legend Entry Using VBA

$
0
0
If you want to hide , add or delete legend entries in the chart using VBA. Try the code given below -


Hide Legend Entry Using VBA


Sub hide_legend()
Dim cht As Chart
Set cht = Sheets("Sheet1").ChartObjects("Chart 1").Chart
    With cht
        .HasLegend = False
    End With
End Sub

ADD Legend Entry Using VBA


Sub add_legend()
Dim cht As Chart
Set cht = Sheets("Sheet1").ChartObjects("Chart 1").Chart
    With cht
        .HasLegend = True
        .Legend.Font.Size = 8
        .Legend.Font.Name = "Arial"
        .Legend.Font.Bold = True
        .Legend.Font.Color = RGB(0, 0, 0)
        .Legend.Font.Italic = True
        .Legend.Position = xlLegendPositionBottom
    End With
End Sub

Delete Legend Entries on the basis of series name Using VBA


Sub delete_legend_entry()

Dim cht As Chart
Dim i As Long

Set cht = Sheets("Sheet1").ChartObjects("Chart 1").Chart
    'loop in all series name
    For i = 1 To cht.SeriesCollection.Count
        'Match the series name
        If cht.SeriesCollection(i).Name = "Jan" Or cht.SeriesCollection(i).Name = "Feb" Then
            'delete the legend entry
            cht.Legend.LegendEntries(i).Delete
        End If
    Next

End Sub


Create In-Cell Charts Using VBA for Data Visualization

$
0
0
If you want to create in-cell charts using VBA . Try this macro -


Sub create_charts()

    Dim i As Long
    Dim cht As Shape
    Dim sht As Worksheet
    
    
    Set sht = ThisWorkbook.Sheets("Data")
    
    'delete all exisitng charts
    For Each cht In sht.Shapes
        If cht.Type = msoChart Then
            cht.Delete
        End If
    Next
    
    ' run loop
    For i = 2 To sht.Range("a65356").End(xlUp).Row
        'call sub procedure to create charts
        Call add_charts_to_cell("'"& sht.Name & "'!"& sht.Range("b"& i & ":e"& i).Address, sht.Range("f"& i), xlBar, "'"& sht.Name & "'!"& sht.Range("b1:e1").Address)
        Call add_charts_to_cell("'"& sht.Name & "'!"& sht.Range("b"& i & ":e"& i).Address, sht.Range("g"& i), xlPie, "'"& sht.Name & "'!"& sht.Range("b1:e1").Address)
    Next
    

End Sub

Sub add_charts_to_cell(chtdata As String, placementcell As Range, chttype As Long, chtcat As String)

    Dim cht As Chart
    Dim ax1 As Axis
    'create chart
    Set cht = ActiveSheet.ChartObjects.Add(Left:=placementcell.Left, Width:=placementcell.Width, Top:=placementcell.Top, Height:=placementcell.Height).Chart
    'format the chart
    On Error Resume Next
    With cht
        .ChartType = chttype
        .HasLegend = False
        .SetSourceData Source:=Range(chtdata)
        .ChartArea.Border.LineStyle = xlNone
        .PlotArea.Border.LineStyle = xlNone
        .ChartArea.Fill.Visible = False
        .PlotArea.Fill.Visible = False
        .HasTitle = False
    End With
    'remove gridlines
    For Each ax1 In cht.axes
        ax1.HasMajorGridlines = False
        ax1.HasMinorGridlines = False
    Next
    'delete axes
    With cht
        .axes(xlCategory).Delete
        .axes(xlValue).Delete
        .SeriesCollection(1).XValues = chtcat
    End With
    
    'format chart on category name
    Call format_charts(cht, Range(chtcat))
    
End Sub


Sub format_charts(cht As Chart, formatrng As Range)

    Dim rng As Range
    Dim srs As Series
    Dim i As Long
    
    
    Set srs = cht.SeriesCollection(1)
    'run loop to format chart
    For i = 1 To srs.Points.Count
        For Each rng In formatrng.Cells
            If UCase(srs.XValues(i)) = UCase(rng.Value) Then
                srs.Points(i).Interior.Color = rng.Offset(1, 0).Interior.Color
                Exit For
            End If
        Next
    Next

End Sub


Download Working File

Note : 

  • Adjust the size of column first in which you will be adding the charts before you run the macro  
  • The macro will first delete all the charts on the worksheet and then it will create new in-cell charts in column F & G
  • Download Sample file and make changes as per your requirement 


Populate form control combo box using VBA

$
0
0
If you want to populate form control combo box  or get selected value using VBA . Try this macro -


Sub method1()
   'change combobox name and sheet here
    With Sheet1.Shapes("drp_down1").ControlFormat
        .RemoveAllItems
        .AddItem "Jan"
        .AddItem "Feb"
        .AddItem "Mar"
    End With
End Sub

Sub method2()
 'change combobox name and sheet here
    With Sheet1.Shapes("drp_down1").ControlFormat
            'change fill range here
            .ListFillRange = "Sheet1!$a$1:$a$5"
    End With
End Sub


Sub method3()

    Dim rng As Range, cl As Range
    'change fill range here
    Set rng = Sheet1.Range("a1:a5")
     'change combobox name and sheet here
     With Sheet1.Shapes("drp_down1").ControlFormat
        .RemoveAllItems
            For Each cl In rng
                .AddItem cl.Value
            Next
     End With

End Sub

Sub method4()

    Dim arr, i As Long
    'change fill range here
    arr = Sheet1.Range("a1:a5")
     'change combobox name and sheet here
     With Sheet1.Shapes("drp_down1").ControlFormat
        .RemoveAllItems
            For i = LBound(arr) To UBound(arr)
                .AddItem arr(i, 1)
            Next
     End With

End Sub

Macro to get selected value


Sub selected_value()
    With Sheet1.Shapes("drp_down1").ControlFormat
        MsgBox .List(.ListIndex)
    End With
End Sub


Populate form control list box using VBA

$
0
0
If you want to populate form control list box using VBA . Try this macro -


Sub method1()
    'change listbox name and sheet here
    With Sheet1.Shapes("lst_box1").ControlFormat
        .RemoveAllItems
        .AddItem "Jan"
        .AddItem "Feb"
        .AddItem "Mar"
    End With
End Sub


Sub method2()
    'change listbox name and sheet here
    With Sheet1.Shapes("lst_box1").ControlFormat
            'change fill range here
            .ListFillRange = "Sheet1!$a$1:$a$5"
    End With
End Sub


Sub method3()

    Dim rng As Range, cl As Range
    'change fill range here
    Set rng = Sheet1.Range("a1:a5")
    'change listbox name and sheet here
     With Sheet1.Shapes("lst_box1").ControlFormat
        .RemoveAllItems
            For Each cl In rng
                .AddItem cl.Value
            Next
     End With

End Sub


Sub method4()

    Dim arr, i As Long
    'change fill range here
    arr = Sheet1.Range("a1:a5")
    'change listbox name and sheet here
     With Sheet1.Shapes("lst_box1").ControlFormat
        .RemoveAllItems
            For i = LBound(arr) To UBound(arr)
                .AddItem arr(i, 1)
            Next
     End With

End Sub


Macro to get all Selected Item/Values


Sub selected_items()

    Dim result1 As String
    
    
    With Sheet1.Shapes("lst_box1").OLEFormat.Object
        For i = 1 To .ListCount
            If .Selected(i) Then
                'Concatenate selected values
                result1 = result1 & ";"& .List(i)
            End If
        Next
    End With
    
    If result1 <> "" Then result1 = VBA.Right(result1, Len(result1) - 1)
    MsgBox result1
    
End Sub

Copy all Charts from activesheet and paste them in different slides of PPT

$
0
0
If you want to loop through all the charts on active-sheet and paste them on different slides of PPT. Try this macro -


Sub export_to_ppt()

'In tools Reference add Microsoft PowerPoint

Dim PPApp           As PowerPoint.Application
Dim PPPres          As PowerPoint.Presentation
Dim PPSlide         As PowerPoint.slide
Dim SlideCount      As Integer
Dim shp             As Shape

    Set PPApp = New PowerPoint.Application
    PPApp.Visible = True
    'create new ppt
    Set PPPres = PPApp.Presentations.Add
    'count no of slides
    
    'set layout of slide
    PPPres.ApplyTemplate Filename:="C:\Program Files\Microsoft Office\Document Themes 12\Median.thmx"' if you want to apply theme
    'loop through all charts
    For Each shp In Sheets(1).Shapes
        If shp.Type = msoChart Then
        
             SlideCount = PPPres.Slides.Count
             Set PPSlide = PPPres.Slides.Add(SlideCount + 1, ppLayoutTitleOnly)
             'add header
             PPSlide.Shapes(1).TextFrame.TextRange.Text = shp.Chart.ChartTitle.Text ' add chart title as header
             'format header
             With PPSlide.Shapes(1).TextFrame.TextRange.Characters
                 .Font.Size = 30
                 .Font.Name = "Arial"
                 .Font.Color = vbWhite
             End With
             
             With PPSlide.Shapes(1)
                 .Fill.BackColor.RGB = RGB(79, 129, 189)
                 .Height = 50
                 .TextFrame.TextRange.ParagraphFormat.Alignment = ppAlignLeft ' left align the header text
             End With
            
             shp.Chart.ChartArea.Copy ' copy chart
             PPApp.ActiveWindow.View.GotoSlide PPSlide.SlideIndex ' activate the slide no
             PPSlide.Shapes.Paste.Select ' paste chart
             'ALIGN THE chart
             PPApp.ActiveWindow.Selection.ShapeRange.Align msoAlignCenters, True
             PPApp.ActiveWindow.Selection.ShapeRange.Align msoAlignMiddles, True
         End If
     Next
    
    Set PPSlide = Nothing
    Set PPPres = Nothing
    Set PPApp = Nothing
  
End Sub


Format dates like 1st, March 2013 2nd March 2013 etc

$
0
0
If you want to format dates like 1st March 2013 , 2nd March 2013 ,etc . Try this macro


Sub fmt_dates()
    Dim Cell As Range
    Dim fmttext As String
    For Each Cell In Selection
        Select Case Day(Cell)
            Case 1, 21, 31:
                fmttext = """st"""
            Case 2, 22:
                fmttext = """nd"""
            Case 3, 23:
                fmttext = """rd"""
            Case Else:
                fmttext = """th"""
        End Select
        Cell.NumberFormat = "d"& fmttext & ", MMMM YYYY"
    Next Cell
End Sub


UDF to extract Column Name

$
0
0
If you want to extract the column name from a range. Try this UDF


Function colname(rng As Range) As String
    Dim arr As Variant
    arr = Split(rng.Address, "$")
    colname = arr(1)
End Function

Export or Save Outlook Email as word document using VBA

$
0
0
If you want to loop through all emails in your outlook inbox and save them as word document in a folder . Try this macro:- 

Option Explicit

Sub sample_macro()
    'reference -> microsoft outlook
    Dim oitem As Outlook.MailItem
    Dim ol As Outlook.Application
    Dim olns As Outlook.Namespace
    Dim oinbox As Outlook.Folder
    Dim j As Long
    
  
    ThisWorkbook.Sheets(1).Range("a2:d"& ThisWorkbook.Sheets(1).Range("a1048576").End(xlUp).Row + 1).Clear 'clear existing data if any
    
    Set ol = New Outlook.Application
    Set olns = ol.GetNamespace("MAPI")
    
    Set oinbox = olns.GetDefaultFolder(olFolderInbox) 'select the inbox
    Set oinbox = oinbox.Folders("Ashish Koul") ' select if you want to choose any specific folder
    oinbox.Items.Sort "[ReceivedTime]", True
    
    j = 2
    
    For Each oitem In oinbox.Items ' loop outlook emails
        ThisWorkbook.Sheets(1).Range("a"& j).Value = oitem.SenderName
        ThisWorkbook.Sheets(1).Range("b"& j).Value = oitem.Subject
        ThisWorkbook.Sheets(1).Range("c"& j).Value = oitem.ReceivedTime
        oitem.SaveAs "C:\Documents and Settings\user\Desktop\emails\"& "Email_"& j - 1 & ".doc", OlSaveAsType.olDoc ' save emails as word document
        ThisWorkbook.Sheets(1).Range("d"& j).Value = "C:\Documents and Settings\user\Desktop\emails\"& "Email_"& j - 1
        j = j + 1
    Next
    
    Set oinbox = Nothing
    Set olns = Nothing
    Set ol = Nothing
End Sub


Interactive USA Map Chart using X Y Scatter and Pie Chart

$
0
0
If you want to show pie images as markers on the map . Snapshot below -


Download the working file


How it is created?

The process is divided into 4 sections

1 Create X Y chart and add US map as background image to the chart

  • Create a simple  X Y scatter chart  
  • Fix the X axis and Y axis option to fixed  snapshot below


  • Insert US map image as background of the chart
  • Right click on chart choose Format Plot Area
  • Choose Fill -> Picture or Texture 
  • Click on file and choose the location of US Map (Map Source   http://en.wikipedia.org/wiki/File:Blank_US_Map.svg )
  • Now Manually choose  X and Y axis for each state
  • Right click on X and Y axis choose Format Axis -> Line Color -> No line
  • Right click on X and Y axis choose  Font color as white
  • Remove grid lines
2.     After this create small (In-cell) pie charts of the data which you will display on the chart markers and export them to the desktop/laptop using macro

3.     Run a loop through all series and import the image of pie charts to the markers using macro

4.     Add chart events code to hide or unhide the textbox on chart sheet and add text to be displayed using VBA


Download the working file
https://www.box.com/s/gmxlj86nykwwyx9rxvw9

Steps to use

  • Save it on your desktop in a new folder
  • Open the file
  • The file is having three tabs
    • Map  - It’s the chart sheet which is updated automatically by macro
    • Lookup - You will find the x and y coordinates for each state listed. Please note do not delete this tab
    • Data – You will add the data on this tab. The sheet is divided into three sections
      • Manual Inputs 
        • Col A- 
          • Add state names in this column
          • Make sure you pick the state name from the Lookup sheet
        • Col B:D
          • Add product details in these columns
          • You can rename the headers as welL
          • If you want to add or remove any product .Please make sure you change the references in macros “change_source_data” and “create_charts
          • Make sure you add color to headers. All pie charts are formatted on the basis of header color
      • Automatically Created by macro
        • Col E
          • Macro will automatically create these charts and export them to the folder
          • In case if you move the position of this column .Please make sure you change the column reference in macro “create_charts
      • Formula columns
        • Col F
          • Add the text you want to display in text box of Chart sheet
          • In case if you move the position of this column. Please make sure you change the column reference in the Map “Chart_MouseMove” event
        • Col  X : Y
          • Get X and Y coordinate of each state from lookup sheet
          • Please note macro is picking x and y coordinates from these columns to update the chart 
          • In case if you move the position of this column. Please make sure you change the column reference in macro “change_source_data


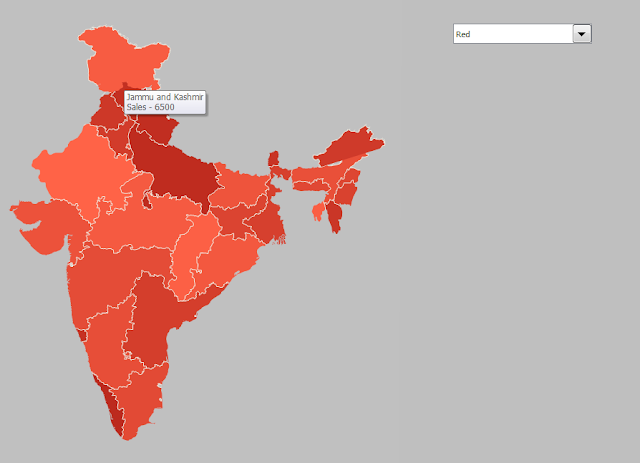
India Heat Map on Excel

$
0
0


I have created a heat map for INDIA. Download and try it
All credit goes to 'www.clearlyandsimply.com’ team. 
Please visit 'www.clearlyandsimply.com’ to try and download various country/region maps on Excel


Below macro is used  to color the shapes and add hyperlink screen tips to give mouse hover effect 


Sub drp_down1()

'Thanks To http://www.clearlyandsimply.com/about.html for posting wonderful stuff on the website
'Please note all color codes and idea behind creating this map is picked from http://www.clearlyandsimply.com
'Please visit his site for amazing map charts on Excel
'http://www.clearlyandsimply.com/clearly_and_simply/2009/06/choropleth-maps-with-excel.html


Dim shp As Object
Dim i As Long, j As Long

' check the color selection made
With Sheet1.Shapes("drp_down1").ControlFormat
    Sheet2.Range("d1").Value = .List(.ListIndex)
End With
    
' remove all the exisiting color from shapes on map
For Each shp In Sheets("Map").Shapes
    On Error Resume Next
    shp.Fill.ForeColor.RGB = RGB(192, 192, 192)
Next

On Error GoTo 0

' add them color as per the slaes rank
For i = 1 To Sheets("Data").Range("a65356").End(xlUp).Row
    For Each shp In Sheets("Map").Shapes
        If UCase(shp.Name) = UCase(Sheets("Data").Range("c"& i).Text) Then
            shp.Fill.ForeColor.RGB = Sheets("Data").Range("d"& i).Value
            
            ' add tool tip to show mouseover effect
            If shp.Type <> msoGroup Then
                Sheet1.Hyperlinks.Add Anchor:=shp, Address:="", SubAddress:="a1", ScreenTip:=Sheets("Data").Range("a"& i).Text & vbCrLf & "Sales - "& Sheets("Data").Range("b"& i).Text
            Else
                For j = 1 To shp.GroupItems.Count
                    Sheet3.Hyperlinks.Add Anchor:=shp.GroupItems(j), Address:="", SubAddress:="a1", ScreenTip:=Sheets("Data").Range("a"& i).Text & vbCrLf & "Sales - "& Sheets("Data").Range("b"& i).Text
                Next
            End If
            
            
            Exit For
        End If
    Next
Next

End Sub


Download the working file and test it

https://www.box.com/s/yaanvkt7vltoyd5np18g


Steps to use


Viewing all 52 articles
Browse latest View live